Introduction to Health Analytics
Introduction to Machine Learning for Health Analytics
What is machine learning?

AI is the broad field of creating computer systems that perform tasks normally requiring human intelligence. These tasks include:
- perception (e.g., recognizing images or speech)
- reasoning and problem solving
- understanding language
- decision-making
Machine learning is a subset of AI that focuses on systems that learn patterns from data
- training: learn from existing data
- prediction: use what was learned to make decisions on new data
Training and testing data

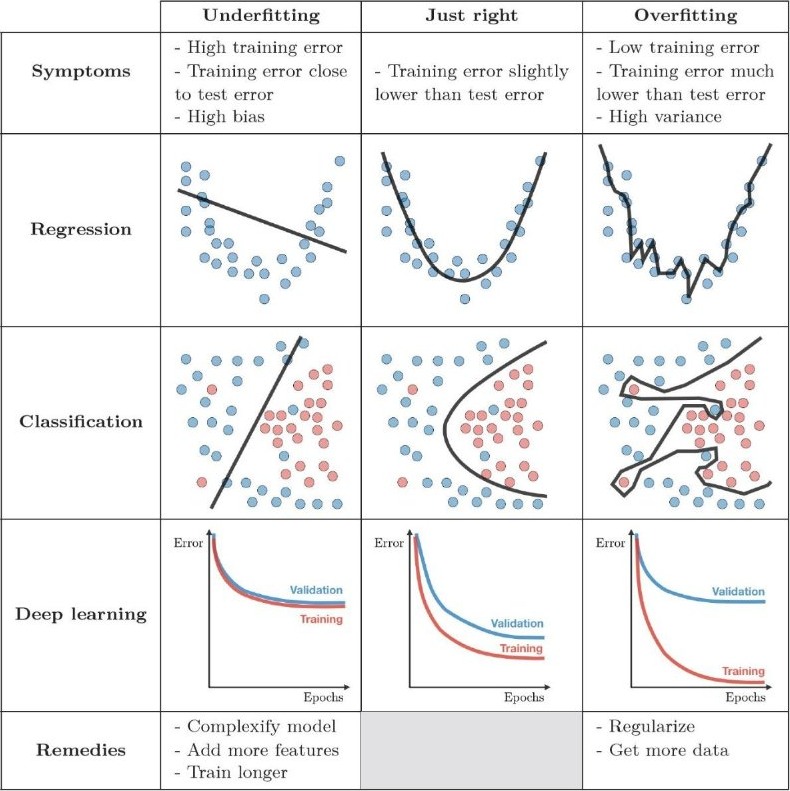
The problem of overfitting

Source: Wonseok Shin
Machine learning methods

Machine learning in R: {tidymodels}
A collection of R packages for statistical modelling and machine learning.
Follows the {tidyverse} principles.
install.packages("tidymodels")

Recipe and workflow

- Recipe: A series of preprocessing steps applied to the data before fitting a model, such as:
- Creating dummy variables for categorical predictors
- Normalizing or transforming numeric variables
- Handling missing values
- Creating interactions or derived features
- Creating dummy variables for categorical predictors
- Workflow: An object that bundles all steps of the modelling process, including:
- Pre-processing (the
recipe)
- The model specification
- Post-processing (e.g. predictions, performance metrics)
- Pre-processing (the
- Workflows ensure the same steps are applied consistently during training, validation, and prediction.
Linear and logistic regression models


LASSO regression
Standard regression: chooses \(\beta\) coefficients to minimize prediction error
Least Absolute Shrinkage and Selection Operator (LASSO): adds a penalty for using large or many coefficients: \[ \min_{\beta} \; \text{Loss}(\beta) \;+\; \lambda \sum_j |\beta_j| \]
Loss function depends on model choice:
- Linear regression: sum of squared residuals (SSR)
- Logistic regression: negative log-likelihood
- Linear regression: sum of squared residuals (SSR)
Key difference
- Regression focuses only on fit
- LASSO trades off fit against model simplicity
- Larger \(\lambda\) pushes more coefficients towards zero
- \(\lambda\) is a hyperparameter
- Regression focuses only on fit

Hyperparameters
Some parts of a model are not learned directly from the data.
Model parameters (e.g. coefficients \(\beta\))
→ estimated during trainingHyperparameters (e.g. \(\lambda\) in LASSO)
→ chosen by the researcher → usually try out a variety of values and test their performance using `cross-validation’ on different splits of the training data → control how the model learnsHyperparameters affect model complexity and overfitting!

ROC curve: performance across thresholds

Source: Martin Thoma (Wikipedia)
- The ROC curve varies the threshold from 0 to 1 and plots:
- True Positive Rate (TPR / sensitivity)
\[ TPR = \frac{TP}{TP+FN} \] - False Positive Rate (FPR)
\[ FPR = \frac{FP}{FP+TN} \]
- True Positive Rate (TPR / sensitivity)
- Each threshold \(\Rightarrow\) one confusion matrix \(\Rightarrow\) one point on the ROC curve.
- ROC AUC = area under the ROC curve
- Interpretable as: probability a randomly chosen positive case gets a higher score than a randomly chosen negative case
- See yardstick.tidymodels.org/articles/metric-types.html.
Decision trees
A tree-like model of decisions and their possible consequences.

What are Random Forests?
An ensemble method
Combines many decision trees.
Can be used for classification or regression problems.
For classification tasks, the output of the random forest is the class selected by most trees.

Source: Tse Ki Chun (Wikimedia)